Business Case for Industry
Please note that this specification is suitable for pre-production pilot implementations.
Purpose
The purpose of this page is to provide a structured framework for building a quantified business case for UNTP implementation at the individual company level. The cost/benefit model, benchmark data, and template below are designed so that any organisation can combine them with their own financial data (e.g. annual report, management accounts) to produce a customised business case. The quantification benchmarks and template below are designed so that any organisation can combine them with their own financial data to produce a customised business case — including with the assistance of AI tools.
We also provide a separate cost/benefit model and business case template for government.
Note: The economic impacts described in this document are projections based on available data and economic models. Actual results will vary. Regular monitoring and evaluation through the UNTP Impact Assessment Framework (IAF) is recommended.
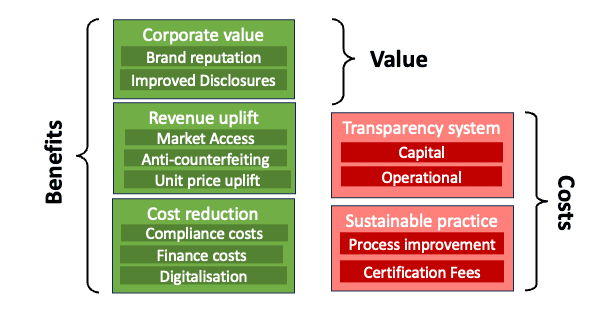
Industry Cost Benefit Model
The high level model shown below breaks benefits into three categories and costs into two categories.
- Benefits accrue through increasing revenue and/or decreasing cost. Improved margins contribute to corporate value, alongside less tangible benefits such as brand reputation and improved regulatory standing.
- Costs are incurred through changes to production processes to achieve greater sustainability and the implementation of traceability and transparency systems to communicate that verifiable sustainability.
Benefits — Revenue Uplift
Market Access
Description — A growing wave of sustainability regulations (EUDR, CBAM, UFLPA, ESPR, CSDDD) is creating mandatory compliance requirements for market access. In many cases these regulations reverse the burden of proof: companies must demonstrate compliance to continue trading in regulated markets. Non-compliant suppliers risk exclusion from high-value export markets entirely.
How UNTP helps — UNTP Digital Product Passports (DPPs) and Digital Conformity Credentials (DCCs) provide the verifiable, machine-readable evidence that importers and regulators require. By presenting credentials that directly address regulatory requirements, suppliers can maintain and expand market access rather than being forced into lower-value commodity channels.
Quantification — Depending on sector and geography, 10–40% of export revenue may be exposed to sustainability regulations. The benefit is measured as market access retained (i.e. revenue that would otherwise be lost due to non-compliance). References: WTO Trade Facilitation Agreement, UNCTAD trade data.
Key variables
- Proportion of revenue from regulated markets (EU, US, Japan, Australia)
- Number and severity of applicable regulations
- Current ability to demonstrate compliance without UNTP
- Competitor readiness — early movers capture displaced market share
Unit Price Uplift
Description — Consumers and business buyers are increasingly willing to pay a premium for products with verified sustainability credentials. Conversely, products that cannot demonstrate sustainability are likely to be pushed into lower-priced commodity markets, creating a widening price gap between verified and unverified goods.
How UNTP helps — UNTP provides rich, verifiable product-level data through DPPs and DCCs that can be presented at point of sale (B2C) or during procurement (B2B). This transforms sustainability from a marketing claim into a verifiable attribute that justifies premium pricing.
Quantification — Consumer goods: 2–8% price premium for verified sustainable products. B2B/industrial: 1–3% price premium. Note: willingness-to-pay surveys report higher figures (10–15%), but actual captured premiums are consistently lower due to the gap between stated preference and purchase behaviour. References: PwC 2024 Voice of the Consumer, Simon-Kucher 2024 Global Sustainability Study.
Key variables
- Sector (consumer goods vs industrial commodities)
- Strength of sustainability differentiation relative to competitors
- Consumer/buyer willingness to pay in target markets
- Existing brand positioning and credibility
Anti-Counterfeiting
Description — Global trade in counterfeit goods is estimated at 2–5% of total trade value. The most impacted sectors are pharmaceuticals and luxury goods, including quality wines and spirits. The proportion that matters commercially is counterfeits unknowingly purchased as genuine, since in many cases buyers of fake luxury goods know the goods are counterfeit.
How UNTP helps — UNTP provides a simple but effective anti-counterfeit mechanism through verifiable product identity linked to Digital Product Passports. When buyers scan a product identifier, they can verify authenticity against the manufacturer's identity resolver. This works particularly well when buyers are motivated to confirm that goods are genuine.
Quantification — Revenue recovery ranges from negligible for commodity goods to material for pharmaceuticals and luxury goods. A benchmark of 0.1–2% of revenue is reasonable depending on sector. Note: OECD estimates of 2–5% refer to total counterfeit trade as a share of global trade, not per-company revenue recovery through anti-counterfeiting measures. References: OECD trends in counterfeit goods, USPTO counterfeit estimates.
Key variables
- Sector (pharma and luxury highest; commodities lowest)
- Brand recognition and attractiveness to counterfeiters
- Geographic markets (counterfeiting more prevalent in some regions)
- Buyer motivation to verify authenticity
Benefits — Cost Reduction
Compliance Costs
Description — Regulatory compliance costs encompass administrative burden of reporting, processing fees, tariffs, border clearance delays, and penalties for non-compliance. As sustainability regulations proliferate, these costs will grow — especially at borders where goods face increasing scrutiny.
How UNTP helps — UNTP Digital Product Passports provide customs authorities and corporate regulators with high-confidence, machine-readable data that can streamline border processing, reduce administrative costs, and minimise delays. For carbon border tariffs such as the EU CBAM, DPPs with actual emissions data enable importers to pay charges on actual rather than default (higher) emissions values, and Digital Traceability Events (DTEs) provide the chain of custody evidence required.
Quantification — 10–20% reduction in compliance administration costs through automated data exchange. Note: this applies to the documentation and reporting component of compliance spend, not to audit fees, tariffs, or testing costs which are not directly reduced by digital credentials. Additional savings from CBAM certificate costs when using actual vs default emissions data. References: EU CBAM, WTO Trade Facilitation Agreement studies.
Key variables
- Current compliance spend (reporting, audits, border costs)
- Exposure to carbon border tariffs (CBAM and similar)
- Volume and frequency of border crossings
- Current level of manual vs automated compliance processes
Finance Costs
Description — Sustainable supply chain finance (SCF) is growing rapidly, yet the global trade finance gap remains approximately $2.5 trillion (ADB 2022), disproportionately affecting SMEs and deep-tier suppliers. Companies with strong, verifiable ESG credentials can access preferential financing terms, reducing their cost of capital and improving margins.
How UNTP helps — UNTP provides a standardised framework based on international standards that enables development banks and commercial lenders to assess ESG risk consistently. This unlocks trade finance for deep-tier suppliers who previously lacked the visibility to qualify. Digital Conformity Credentials provide the verifiable ESG evidence that lenders require, while the transparency graph enables risk assessment across multiple supply chain tiers.
Quantification — 2–10% reduction in financing costs for companies with verified sustainability credentials. Sustainability-linked loans typically offer margin reductions of 5–25 basis points; the benefit is most material for companies with large debt portfolios or those currently constrained by the trade finance gap. References: ADB Trade Finance Gaps 2023, IFC Sustainable Finance 2020.
Key variables
- Current financing costs and access to trade finance
- Depth and complexity of supply chain
- ESG maturity and existing certifications
- Lender appetite for sustainable finance products in relevant markets
Digitalisation Efficiency
Description — Digitalisation through UNTP enables automated data collection and processing, reducing manual labour and errors. Enhanced visibility into supply chain activities allows for better inventory management, demand forecasting, and faster decision-making. Access to accurate, real-time data improves overall operational performance.
How UNTP helps — UNTP Digital Traceability Events and Digital Product Passports provide standardised, machine-readable data flows across the supply chain. This data integrates with existing ERP and supply chain management systems, automating processes that were previously manual. The transparency graph provides end-to-end visibility that supports predictive analytics and proactive management.
Quantification — 3–10% reduction in supply chain documentation and data management costs through automation and standardised data exchange. Note: UNTP adds a credential and data interoperability layer — it is not a full supply chain digitalisation platform. Benefits are concentrated in cross-enterprise data exchange (supplier data collection, compliance documentation, traceability reporting) rather than internal operations. References: McKinsey digital transformation reports.
Key variables
- Current level of supply chain digitalisation
- Volume and complexity of supply chain transactions
- Number of manual processes that can be automated
- Integration capability of existing IT systems
Benefits — Corporate Value
Brand Reputation
Description — Transparency in supply chains builds consumer trust, as customers and investors are increasingly concerned about the ethical and environmental impact of products. Companies that can demonstrate verifiable commitment to sustainability are more likely to gain consumer loyalty, attract investment, and command brand premiums.
How UNTP helps — UNTP provides the verifiable evidence behind sustainability claims, moving beyond marketing assertions to machine-verifiable credentials. Digital Product Passports make sustainability data accessible to consumers, investors, and rating agencies. This builds trust through transparency rather than narrative.
Quantification — Qualitative benefit. While studies suggest correlations between sustainability perception and brand value, the effect of any single initiative (including UNTP) is impossible to isolate from other factors such as marketing spend, product quality, and competitive dynamics. Brand value effects typically manifest over medium-to-long time horizons. References: Brand Finance Sustainability Perceptions 2025.
Key variables
- Current brand value and market positioning
- Consumer sensitivity to sustainability in target markets
- Competitor sustainability positioning
- Consistency and credibility of current sustainability messaging
Improved Disclosures
Description — Regulations mandating annual corporate sustainability disclosures are in force or being drafted in most economies. They generally require reporting of concrete metrics such as CO2-equivalent emissions, including scope 3 (upstream supply chain) emissions. Most corporations lack the supplier data to directly measure scope 3, forcing reliance on industry-average intensity factors — which provide no mechanism to reward or select lower-intensity suppliers.
How UNTP helps — Digital Product Passports from suppliers provide direct measurement of product-level sustainability performance, replacing industry-average estimates. This enables corporations to select more sustainable supply and demonstrate year-on-year improvement in their own aggregate performance. The transparency graph aggregates supplier DPPs into disclosure-ready metrics.
Quantification — Qualitative benefit. Companies with verifiable supply chain data can demonstrate actual (rather than estimated) scope 3 performance, which strengthens regulatory compliance posture and supports better outcomes across all other benefit categories (brand, finance, market access). The value is in moving from estimated to actual data — the magnitude of improvement is organisation-specific and depends on the gap between current estimates and actual supplier performance. References: WBCSD Pathfinder 2.0 Framework.
Key variables
- Scope 3 emissions as proportion of total emissions
- Number and diversity of suppliers
- Current reliance on industry-average vs actual data
- Applicable disclosure regulations (CSRD, SEC climate rules, ISSB)
Costs — Sustainable Practices
Process Improvement
Description — Suppliers are often required to implement ESG improvements aligned with buyers' sustainability strategies. This may include reducing carbon emissions from energy-intensive processes, switching to renewable energy sources, eliminating harmful chemicals, or improving labour practices. These transitions require real investment but are often partially offset by efficiency gains and green finance.
How UNTP helps — UNTP does not directly reduce the cost of process improvement, but it ensures that investments in sustainability are visible and valued by the market. DPPs and DCCs make improvement verifiable, enabling suppliers to capture the market access, price premium, and finance benefits described above. This makes the business case for process improvement stronger and the payback period shorter.
Quantification — 2–8% of operational costs for the first 3 years of ESG transition, declining as improvements are embedded. Partially offset by green finance grants and efficiency gains. References: IFC transition cost data, UNIDO industrial energy efficiency studies.
Key variables
- Current sustainability maturity (more to do = higher initial cost)
- Sector-specific transition requirements
- Availability of green finance and grants
- Energy and material cost structures
Audits and Certification
Description — Third-party certification is the most credible way to verify sustainability claims, carrying greater weight than self-assessment or buyer audits for both voluntary and regulatory compliance. Certifications typically need to be obtained for each relevant ESG risk area, with costs for initial certification and ongoing annual surveillance.
How UNTP helps — UNTP Digital Conformity Credentials digitise certification evidence, making it reusable across multiple buyers and regulatory contexts. Multi-scheme mutual recognition, facilitated by the Conformity Assessment Body (CAB) framework, reduces duplication by allowing a single assessment to satisfy multiple requirements.
Quantification — $10K–$50K per certification type (initial assessment); $5K–$20K annual surveillance. Multi-scheme recognition through UNTP can reduce total certification costs by consolidating overlapping requirements.
Key variables
- Number of certification schemes required by buyers/regulators
- Complexity of operations being assessed
- Geographic spread of facilities
- Existing certifications that may satisfy multiple requirements
Costs — Transparency System
Capital Investment
Description — Implementing a UNTP-conformant transparency system requires consulting to assess the supply chain structure and data elements, software integration or adaptation, staff training, and project management. The scale of investment depends significantly on organisation size and existing digital maturity.
How UNTP helps — UNTP is designed to work with existing systems rather than requiring replacement. The protocol specifies open standards and interoperable data formats, allowing organisations to extend their current ERP, supply chain, and compliance systems. When implemented at community level through a Community Activation Program (CAP), costs are significantly reduced as software vendors implement UNTP once for all their customers.
Quantification — $50K–$200K for SMEs; $200K–$1M for large enterprises. Significantly reduced when implemented at community level via CAP, as software vendors, certifiers, and industry associations share implementation costs across their communities.
Key variables
- Organisation size and supply chain complexity
- Existing digital maturity and system landscape
- Whether implementing individually or as part of a community
- Availability of UNTP-ready software from existing vendors
Operational Costs
Description — Ongoing costs include credential issuance (signing and hosting DPPs, DCCs, DTEs), identity resolver hosting, system maintenance, and staff to manage the transparency system. UNTP is designed to work with what is already available, so these costs are typically incremental to existing IT operations.
How UNTP helps — UNTP's standards-based approach means that operational costs leverage existing infrastructure. Credential issuance can be automated as part of existing business processes (e.g. issuing a DPP as part of shipping documentation). Identity resolver hosting can be shared at community level.
Quantification — $10K–$50K/year for SMEs; $50K–$200K/year for large enterprises. Often largely absorbed into existing IT operations budgets.
Key variables
- Transaction volume (number of credentials issued per year)
- Whether resolver hosting is individual or shared
- Level of automation achieved during implementation
- Existing IT operations budget and capacity
Business Case Template
A downloadable business case template with quantification summary table and narrative structure is available as a Word document. The template is designed to be populated using the benchmark ranges above combined with organisation-specific financial data (e.g. annual report, management accounts) — including with the assistance of AI tools as described below.
Generate Your Own Business Case
You can use a frontier AI model (such as ChatGPT, Claude, or Gemini) to generate a first-draft business case for your organisation. Upload your company's annual report (PDF) alongside the prompt below. The AI will extract your financial data, apply the UNTP benchmark ranges weighted to your specific industry and geography, and produce a complete draft business case using the template above.
Prerequisites: This prompt requires a frontier AI model with a large context window (100K+ tokens) and the ability to process PDF attachments. You will likely need a professional-tier subscription (e.g. ChatGPT Plus/Pro, Claude Pro, Gemini Advanced) to handle the combined size of the annual report, the UNTP cost/benefit framework, and the business case template in a single session.
Important disclaimer: The generated business case is only an initial draft. AI models may misinterpret financial data, apply benchmark ranges inappropriately, or make unfounded assumptions about your organisation's regulatory exposure, supply chain structure, or competitive position. The output should be thoroughly reviewed and adjusted by subject matter experts before being used for any decision-making purpose.
How to use: Copy the prompt below, open your preferred AI assistant, attach your annual report PDF, paste the prompt, and submit.
You are preparing a first-draft UNTP business case for the company whose annual report is attached.
Input documents
-
Annual report — attached PDF. Extract: company name, sector, revenue, export revenue, geographic markets, supply chain description, existing certifications/sustainability initiatives, ESG disclosures, and any mentions of regulatory compliance costs or sustainability spending.
-
UNTP cost/benefit framework — fetch from https://untp.unece.org/business-case/BusinessCaseIndustry and use the benchmark ranges for each benefit and cost category.
-
Business case template — fetch from https://untp.unece.org/assets/files/UNTP-Business-Case-Template-Industry.docx and use this as the output structure. Fill in every section and every bracketed placeholder.
How to weight each benefit category
IMPORTANT: Always err on the side of conservatism. Use the lower end of each benchmark range unless there is strong, specific evidence from the annual report to justify a higher figure. A credible business case with conservative estimates is far more useful than an optimistic one that loses credibility under scrutiny. When in doubt, round down. If evidence for a benefit category is weak or absent, use the minimum of the range or exclude it entirely.
Weight each benefit category based on what you know about this specific company, its sector, and its geography:
- Market access — weight HIGH if the company exports to the EU, US, Japan, or Australia and operates in sectors subject to EUDR, CBAM, ESPR, UFLPA, or CSDDD. Weight LOW if primarily domestic or in unregulated sectors.
- Unit price uplift — weight HIGH for consumer-facing brands with sustainability positioning. Weight LOW for undifferentiated commodity producers.
- Anti-counterfeiting — weight HIGH for pharmaceuticals, luxury goods, premium wines/spirits. Weight NEAR-ZERO for bulk commodities, construction materials, most B2B industrials. Note: the benchmark range (0.1–2%) refers to per-company revenue recovery, not total counterfeit trade volume.
- Compliance cost reduction — weight HIGH if the company reports significant regulatory compliance spend or operates across many jurisdictions. Weight MEDIUM for most exporters.
- Finance cost reduction — weight HIGH if the company mentions trade finance constraints, operates in developing countries, or is an SME. Weight LOW for investment-grade corporates with strong ESG ratings already.
- Operational efficiency — weight HIGH if the company has complex multi-tier supply chains with manual processes. Weight LOW if already highly digitised.
- Brand reputation — weight HIGH for consumer brands. Weight LOW for B2B intermediaries.
- Improved disclosures — weight HIGH if the company reports under CSRD, ISSB, or SEC climate rules and acknowledges scope 3 data gaps. Weight LOW if not subject to disclosure regulations.
For costs, adjust based on:
- Organisation size — use the low end of capital investment ranges for SMEs, high end for large enterprises.
- Digital maturity — reduce cost estimates if the company already has modern ERP/supply chain systems.
- Community implementation — reduce costs significantly if the company operates in a sector with an active UNTP Community Activation Program.
Output requirements
- Populate the full template — every section, every table, every placeholder. Use actual figures from the annual report where available; use informed estimates (with reasoning) where not.
- In section 4.4 (Estimation Assumptions), assign a confidence level (H/M/L) to each benefit and explain your reasoning based on the company's specific context.
- In section 4.3 (Net Value and Payback), provide conservative, base case, and optimistic scenarios. The conservative case should use the low end of applicable ranges; the optimistic case should use the high end.
- In section 6 (Dependencies), assess the actual readiness of the ecosystem the company operates in — name specific software vendors, registers, and conformity schemes relevant to its sector and geography.
- In section 7.3 (Do-Nothing Risk), be specific about which regulations affect this company and by when.
- Throughout, show your working — explain why you chose a particular point in a benchmark range, citing specific evidence from the annual report or your knowledge of the sector.
Output format
Download the business case template from https://untp.unece.org/assets/files/UNTP-Business-Case-Template-Industry.docx and produce the output as a completed version of that Word document. Fill in every bracketed placeholder, populate every table, and replace all instructional text with company-specific content. The output should be a ready-to-review Word document that can be presented to a board or investment committee without further formatting.